Understanding Geth's dashboard
Last edited on July 11, 2024Our dashboards page explains how to set up a Grafana dashboard for monitoring your Geth node. This page explores the dashboard itself, explaining what the various metrics are and what they mean for the health of a node. Note that the raw data informing the dashboard can be viewed in JSON format in the browser by navigating to the ip address and port passed to --metrics.addr and --metrics.port (127.0.0.1:6060 by default).
What does the dashboard look like?
The default Grafana dashboard looks as follows (note that there are many more panels on the actual page than in the snapshot below):
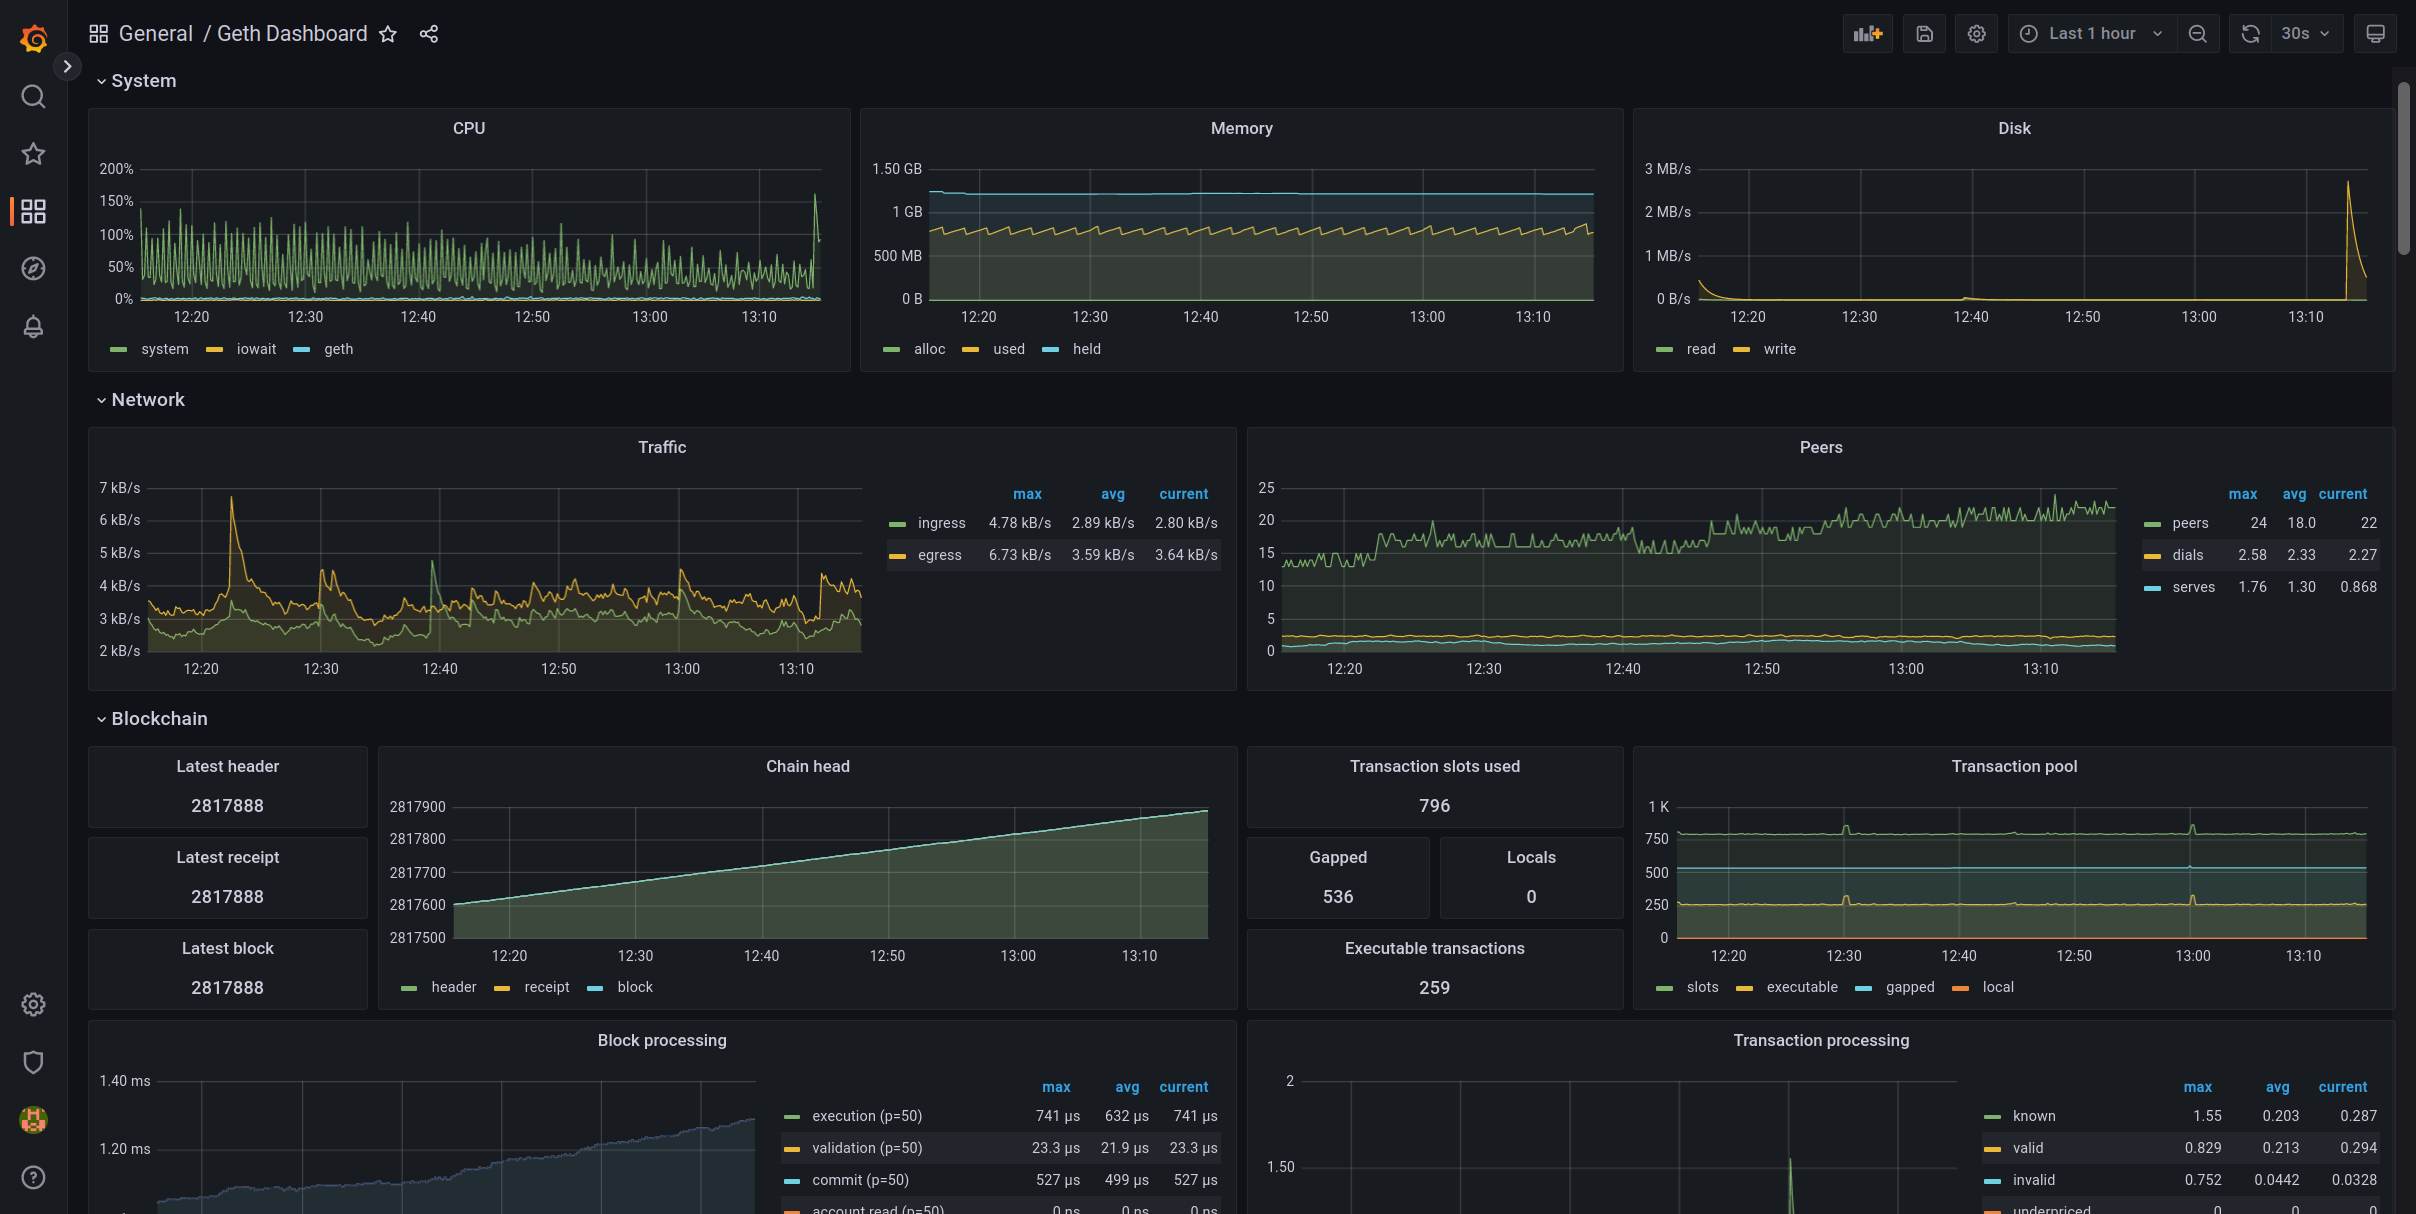
Each panel in the dashboard tracks a different metric that can be used to understand some aspect of how a Geth node is behaving. There are three main categories of panel in the default dashboard: System, Network and Blockchain. The individual panels are explained in the following sections.
What do the panels show?
System
Panels in the System category track the impact of Geth on the local machine, including memory and CPU usage.
CPU
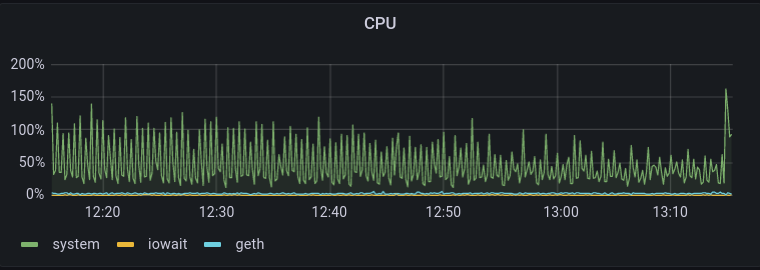
The CPU panel shows how much CPU is being used as a percentage of one processing core (i.e. 100% means complete usage of one processing core, 200% means complete usage of two processing cores). There are three processes plotted on the figure. The total CPU usage by the entire system is plotted as system; the percentage of time that the CPUs are idle waiting for disk i/o operations is plotted as iowait; the CPU usage by the Geth process is plotted as geth.
Memory
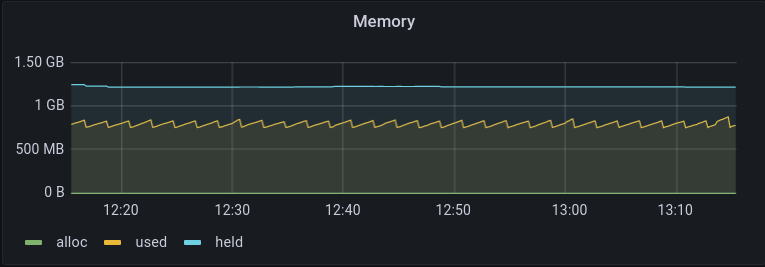
Memory tracks the amount of RAM being used by Geth. Three metrics are plotted: the cache size, i.e. the total RAM reserved for Geth (default 1024 MB) is plotted as held; the amount of the cache actually being used by Geth is plotted as used; the number of bytes being allocated by the system per second is plotted as alloc.
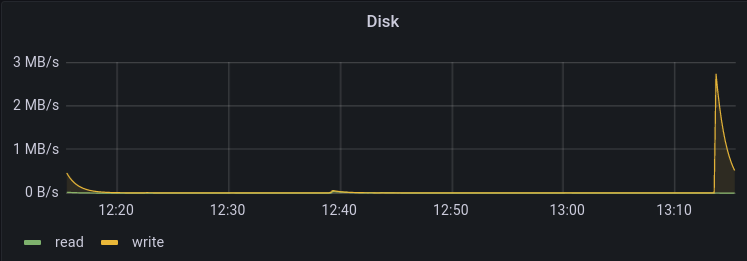
Disk
Disk tracks the rate that data is written to (plotted as write) or read from (plotted as read) the hard disk in units of MB/s.
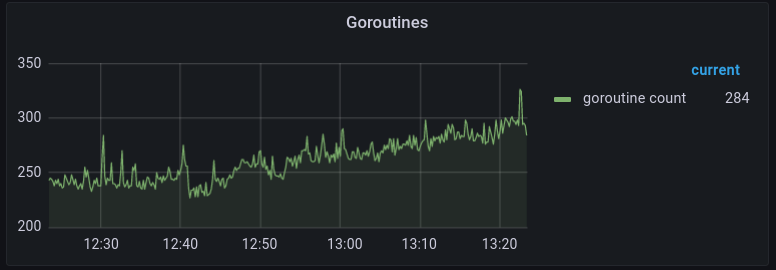
Goroutines
Tracks the total number of active goroutines being used by Geth. Goroutines are lightweight threads managed by the Go runtime, they allow processes to execute concurrently.
Network
Panels in the Network category track the data flow in and out of the local node.
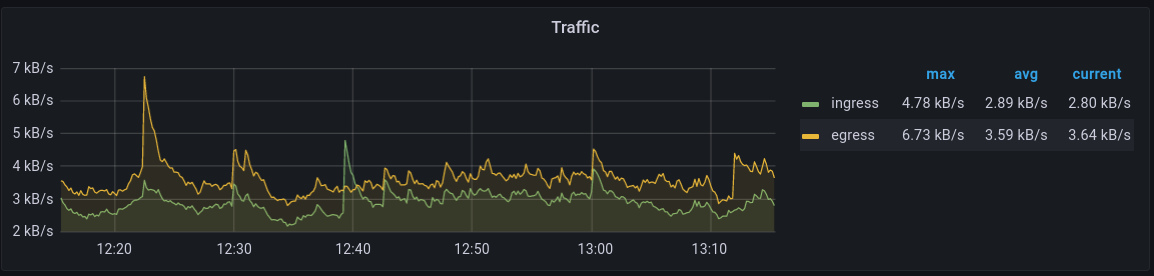
Traffic
The Traffic panel shows the rate of data ingress and egress for all subprotocols, measured in units of kB/s.
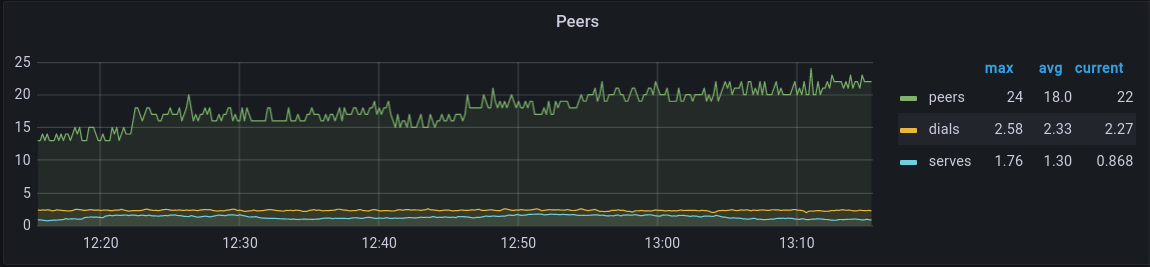
Peers
The Peers panel shows the number of individual peers the local node is connected to. The number of dials issued by Geth per second and the number of external connections received per second are also tracked in this panel.
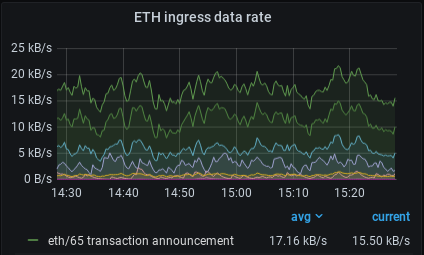
ETH ingress data rate
Ingress is the process of data arriving at the local node from its peers. This panel shows the rate that data specifically using the eth subprotocol is arriving at the local node in units of kB/s (kilobytes per second). The data is subdivided into specific versions of the ETH subprotocol. Make sure your dashboard includes the latest version of the eth subprotocol!
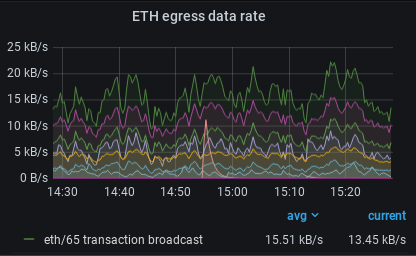
ETH egress data rate
Egress is the process of data leaving the local node and being transferred to its peers. This panel shows the rate that data specifically using the eth subprotocol is leaving the local node in units of kB/s (kilobytes per second). Make sure your dashboard includes the latest version of the eth subprotocol!
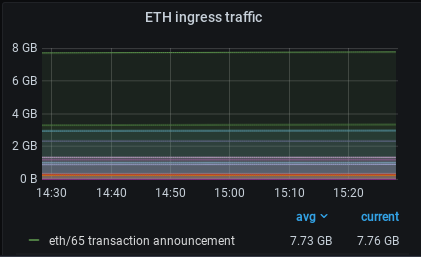
ETH ingress traffic
Ingress is the process of data arriving at the local node from its peers. This panel shows a moment-by-moment snapshot of the amount of data that is arriving at the local node, specifically using the eth subprotocol, in units of GB (gigabytes). Make sure your dashboard includes the latest version of the eth subprotocol!
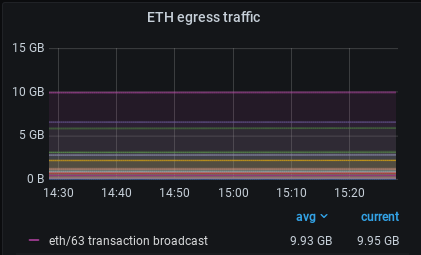
ETH egress traffic
Egress is the process of data leaving the local node and being transferred to its peers. This panel shows a moment-by-moment snapshot of the amount of data that has left the local node, specifically using the eth subprotocol, in units of GB (gigabytes). Make sure your dashboard includes the latest version of the eth subprotocol!
Blockchain
Panels in the Blockchain category track the local node's view of the blockchain.
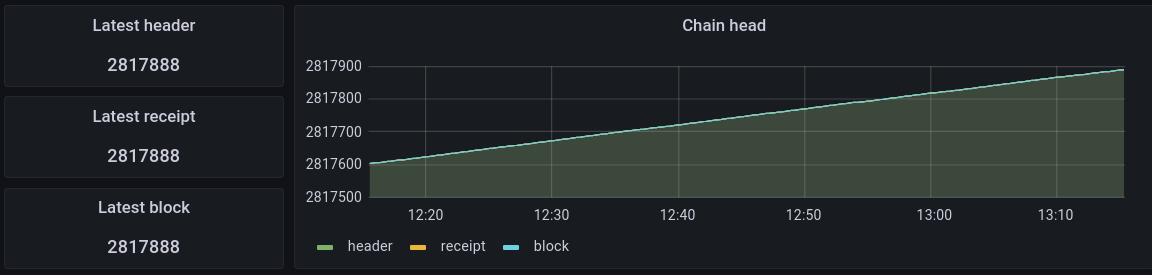
Chain head
The chain head simply tracks the latest block number that the local node is aware of.
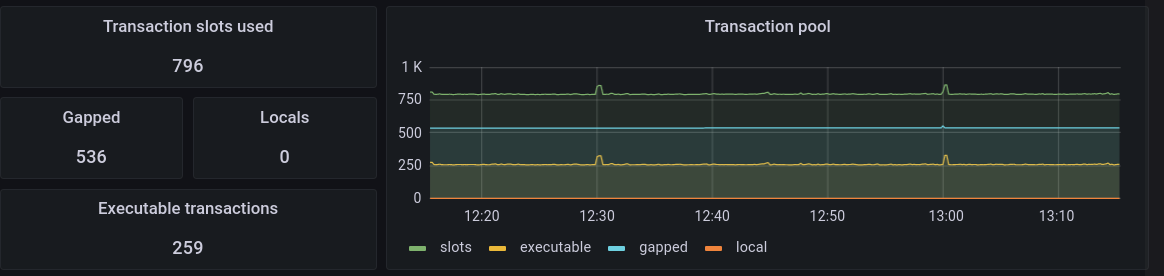
Transaction pool
Geth has a capacity for pending transactions defined by --txpool.globalslots (default is 5160). The number of slots filled with transactions is tracked as slots. The transactions in the pool are divided into pending transactions and queued transactions. Pending transactions are ready to be processed and included in a block, whereas queued transactions are those whose transaction nonces are out of sequence. Queued transactions can become pending transactions if transactions with the missing nonces become available. In the dashboard pending transactions are labelled as executable and queued transactions are labelled gapped. The subset of those global transactions that originated from the local node are tracked as local.
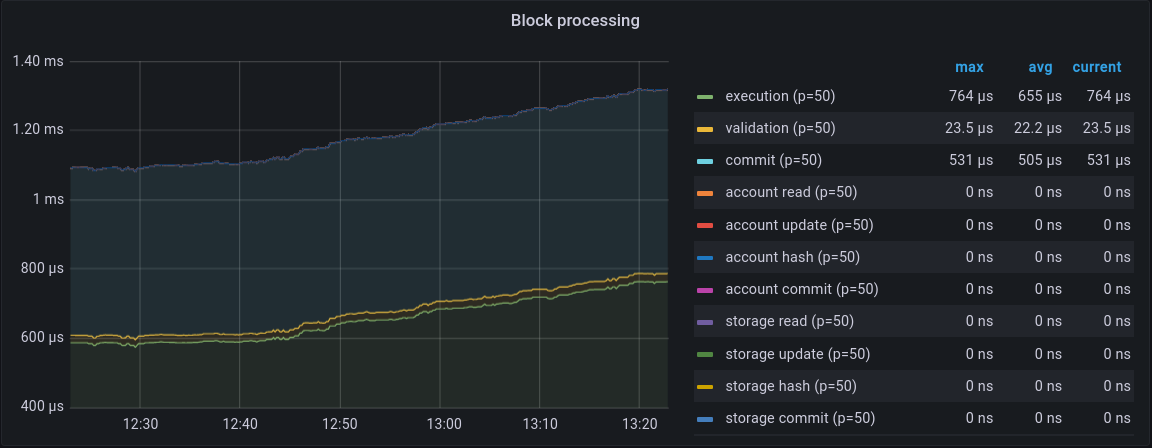
Block processing
The block processing panel tracks the time taken to complete the various tasks involved in processing each block, measured in microseconds or nanoseconds. Specifically, this includes:
- execution: time taken to execute the transactions in the block
- validation: time taken to validate that the information in a received block body matches what is described in the block header.
- commit: time taken to write the new block to the chain data
- account read: time taken to access account information from the state trie
- account update: time taken to incorporate dirty account objects into the state trie (account trie)
- account hash: time taken to re-compute the new root hash of the state trie (account trie)
- account commit: time taken to commit the changes of state trie (account trie) into database
- storage read: time taken to access smart contract storage data from the storage trie
- storage update: time taken to incorporate dirty storage slots into the storage tries
- storage hash: time take to re-compute the new root hash of storage tries
- storage commit: time take to commit the changes of storage tries into database
- snapshot account read: time taken to read account data from a snapshot
- snapshot storage read: time taken to read storage data from a snapshot
- snapshot commit: time take to flush the dirty state data as a new snapshot
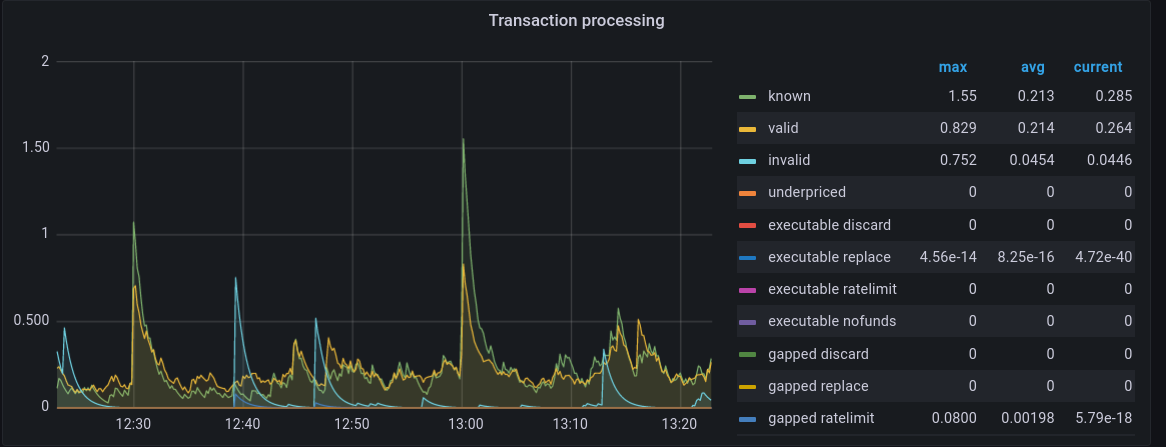
Transaction processing
The transaction processing panel tracks the time taken to complete the various tasks involved in validating the transactions received from the network, measured as a mean rate of events per second:
- known: rate of new transactions arriving at the node that are ignored because the local node already knows about them.
- valid: rate that node marks received transactions as valid
- invalid: rate that node marks received transactions as invalid
- underpriced: rate that node marks transactions paying too low gas price as rejected
- executable discard: rate that valid transactions are dropped from the transaction pool, e.g. because it is already known.
- executable replace: rate that valid transactions are replaced with a new one from same sender with same nonce but higher gas
- executable ratelimit: rate that valid transactions are dropped due to rate-limiting
- executable nofunds: rate that valid transactions are dropped due to running out of ETH to pay gas
- gapped discard: rate that queued transactions are discarded from the transaction pool
- gapped replace: rate that queued transactions are replaced with a new one from same sender with same nonce but higher gas
- gapped ratelimit: rate that queued transactions are dropped due to rate limiting
- gapped nofunds: rate that queued transactions are dropped due to running out of ETH to pay gas
Block propagation
Note
Block propagation was disabled in Geth at The Merge. Block propagation is now the responsibility of the consensus client. Included here for archival interest.
Block propagation metrics track the rate that the local node hears about, receives and broadcasts blocks. This includes:
- ingress announcements: the number of inbound announcements per second. Announcements are messages from peers that signal that they have a block to share
- known announcements: the number of announcements per second the local node is already aware of them
- malicious announcements: the number of announcements per second that are determined to be malicious, e.g. because they are trying to mount a denial-of-service attack on the local node
- ingress broadcasts: the number of blocks directly propagated to local node per second
- known broadcasts: counts all blocks that have been broadcast by peers including those that are too far behind the head to be downloaded
- malicious broadcasts: the number of blocks which are determined to be malicious per second
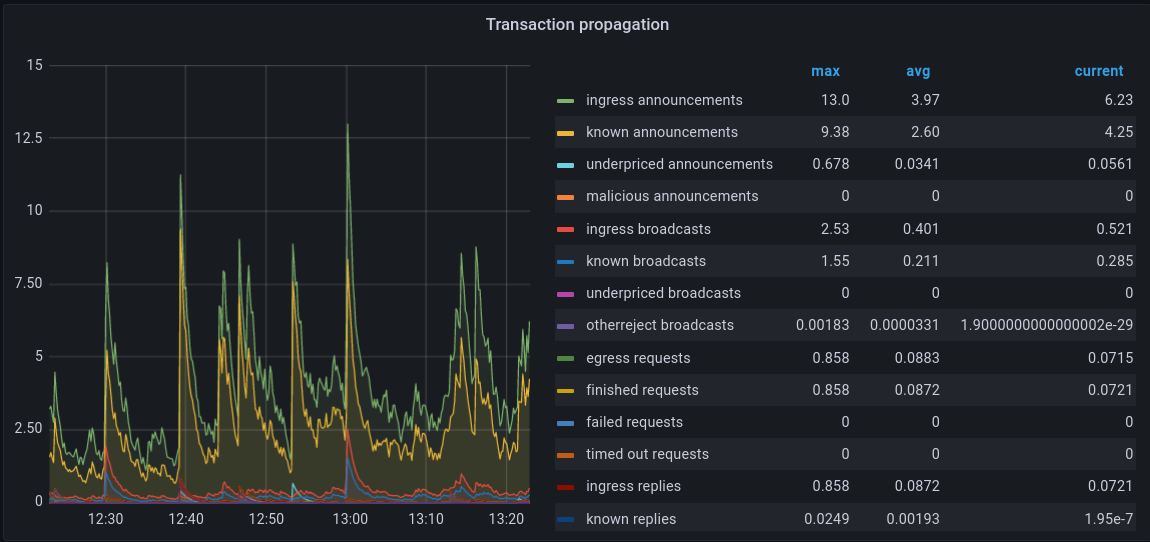
Transaction propagation
Transaction propagation tracks the sending and receiving of transactions on the peer-to-peer network. This includes:
- ingress announcements: inbound announcements (notifications of a transaction's availability) per second
- known announcements: announcements that are ignored because the local node is already aware of them, per second
- underpriced announcements: announcements per second that do not get fetched because they pay too little gas
- malicious announcements: announcements per second that are dropped because they appear malicious
- ingress broadcasts: number of transactions propagated from peers per second
- known broadcasts: transactions per second that are ignored because they duplicate transactions that the local node already knows about
- underpriced broadcasts: all fetched transactions that are dropped due to paying insufficient gas, per second
- otherreject broadcasts: transactions that are rejected for reasons other than paying too little gas, per second
- finished requests: successful deliveries of transactions per second, meaning they have been added to the local transaction pool
- failed requests: number of failed transaction deliveries per second, e.g. failed because a peer disconnected unexpectedly
- timed out requests: counts the number of transaction requests that time out per second
- ingress replies: total number of inbound replies to requests for transactions per second
- known replies: number of replies that are dropped because they are already known to the local node, per second
- underpriced replies: number of replies per second that get dropped due to paying too little gas
- otherreject replies: number of replies to transaction requests that get dropped for reasons other than paying too little gas, per second
Block forwarding
The block forwarding panel counts the announcements and the blocks that the local node receives that it should pass on to its peers.
Transaction fetcher peers
The transaction fetcher peers panel shows how many peers the local node is connected to that can serve requests for transactions. The adjacent transaction fetcher hashes panel shows how many transaction hashes are available for fetching. Three statuses are reported in each panel: Waiting, queuing and fetching.
Reorg
The reorg meter panel simply counts the blocks added and the blocks removed during chain reorgs. The adjacent Reorg total panel shows the total number of reorg executions including both additions and removals.
Eth fetcher filter bodies/headers
Tracks the rate that headers/block bodies arrive from remote peers.
Database
The database section tracks various metrics related to data storage and i/o in the LevelDB and ancients databases.
Data rate
Measures the rate that data is written to, or read from, the LevelDB and ancients databases. Includes:
- leveldb read: Rate that data is read from the fast-access LevelDB database that stores recent data.
- leveldb write: Rate that data is written to the fast-access LevelDB database that stores recent data.
- ancient read: Rate that data is read from the freezer (the database storing older data).
- ancient write: Rate that data is written to the freezer (the database storing older data)
- compaction read: Rate that data is read from the LevelDB database while it is being compacted (i.e. free space is reclaimed by deleting unnecessary data)
- compaction write: Rate that data is written to the LevelDB database while it is being compacted (i.e. free space is reclaimed by deleting unnecessary data)
Session totals
Instead of the rate that data is read from, and written to, the LevelDB and ancients databases (as per Data rate), this panel tracks the total amount of data read and written across the entire time Geth is running.
Persistent size
This panel shows the amount of data, in GB, in the LevelDB and ancients databases.
Compaction time, delay and count
These panels show the amount of time spent compacting the LevelDB database, duration write operations to the database are delayed due to compaction and the count of various types of compaction executions.
Note
The current default Geth Grafana dashboard includes panels for light nodes. Light nodes are not currently functional since Ethereum moved to proof-of-stake.
Creating new dashboards
If the default dashboard isn't right for you, you can update it in the browser. Remove panels by clicking on their titles and selecting remove. Add a new panel by clicking the "plus" icon in the upper right of the browser window. There, you will have to define an InfluxDB query for the metric you want to display. The endpoints for the various metrics that Geth reports are listed by Geth at the address/port combination passed to --metrics.addr and metrics.port on startup - by default 127.0.0.1:6060/debug/metrics. It is also possible to configure a panel by providing a JSON configuration model. Individual components are defined using the following syntax (the example below is for the CPU panel):
{
  "id": 106,
  "gridPos": {
    "h": 6,
    "w": 8,
    "x": 0,
    "y": 1
  },
  "type": "graph",
  "title": "CPU",
  "datasource": {
    "uid": "s1zWCjvVk",
    "type": "influxdb"
  },
  "thresholds": [],
  "pluginVersion": "9.3.6",
  "links": [],
  "legend": {
    "alignAsTable": false,
    "avg": false,
    "current": false,
    "max": false,
    "min": false,
    "rightSide": false,
    "show": true,
    "total": false,
    "values": false
  },
  "aliasColors": {},
  "bars": false,
  "dashLength": 10,
  "dashes": false,
  "fieldConfig": {
    "defaults": {
      "links": []
    },
    "overrides": []
  },
  "fill": 1,
  "fillGradient": 0,
  "hiddenSeries": false,
  "lines": true,
  "linewidth": 1,
  "nullPointMode": "connected",
  "options": {
    "alertThreshold": true
  },
  "percentage": false,
  "pointradius": 5,
  "points": false,
  "renderer": "flot",
  "seriesOverrides": [],
  "spaceLength": 10,
  "stack": false,
  "steppedLine": false,
  "targets": [
    {
      "alias": "system",
      "expr": "system_cpu_sysload",
      "format": "time_series",
      "groupBy": [
        {
          "params": ["$interval"],
          "type": "time"
        }
      ],
      "intervalFactor": 1,
      "legendFormat": "system",
      "measurement": "geth.system/cpu/sysload.gauge",
      "orderByTime": "ASC",
      "policy": "default",
      "refId": "A",
      "resultFormat": "time_series",
      "select": [
        [
          {
            "params": ["value"],
            "type": "field"
          },
          {
            "params": [],
            "type": "mean"
          }
        ]
      ],
      "tags": [
        {
          "key": "host",
          "operator": "=~",
          "value": "/^$host$/"
        }
      ],
      "datasource": {
        "uid": "s1zWCjvVk",
        "type": "influxdb"
      }
    },
    {
      "alias": "iowait",
      "expr": "system_cpu_syswait",
      "format": "time_series",
      "groupBy": [
        {
          "params": ["$interval"],
          "type": "time"
        }
      ],
      "intervalFactor": 1,
      "legendFormat": "iowait",
      "measurement": "geth.system/cpu/syswait.gauge",
      "orderByTime": "ASC",
      "policy": "default",
      "refId": "B",
      "resultFormat": "time_series",
      "select": [
        [
          {
            "params": ["value"],
            "type": "field"
          },
          {
            "params": [],
            "type": "mean"
          }
        ]
      ],
      "tags": [
        {
          "key": "host",
          "operator": "=~",
          "value": "/^$host$/"
        }
      ],
      "datasource": {
        "uid": "s1zWCjvVk",
        "type": "influxdb"
      }
    },
    {
      "alias": "geth",
      "expr": "system_cpu_procload",
      "format": "time_series",
      "groupBy": [
        {
          "params": ["$interval"],
          "type": "time"
        }
      ],
      "intervalFactor": 1,
      "legendFormat": "geth",
      "measurement": "geth.system/cpu/procload.gauge",
      "orderByTime": "ASC",
      "policy": "default",
      "refId": "C",
      "resultFormat": "time_series",
      "select": [
        [
          {
            "params": ["value"],
            "type": "field"
          },
          {
            "params": [],
            "type": "mean"
          }
        ]
      ],
      "tags": [
        {
          "key": "host",
          "operator": "=~",
          "value": "/^$host$/"
        }
      ],
      "datasource": {
        "uid": "s1zWCjvVk",
        "type": "influxdb"
      }
    }
  ],
  "timeFrom": null,
  "timeRegions": [],
  "timeShift": null,
  "tooltip": {
    "shared": true,
    "sort": 0,
    "value_type": "individual"
  },
  "xaxis": {
    "buckets": null,
    "mode": "time",
    "name": null,
    "show": true,
    "values": []
  },
  "yaxes": [
    {
      "format": "percent",
      "label": null,
      "logBase": 1,
      "max": null,
      "min": null,
      "show": true
    },
    {
      "format": "short",
      "label": null,
      "logBase": 1,
      "max": null,
      "min": null,
      "show": true
    }
  ],
  "yaxis": {
    "align": false,
    "alignLevel": null
  }
}